Supervised Learning Explained: Classification and Regression
Master the foundation of production AI - from Gmail's spam detection to Tesla's Autopilot
Read 25 min
Supervised Learning Classification Regression ML Fundamentals Data Quality
Supervised learning powers 70% of production AI systems, from Gmail's spam detection to Tesla's object recognition. The key to success isn't choosing fancy algorithms-it's having good data and solving the right problem. PayPal's $5B fraud prevention and Google's 99.9% spam accuracy prove that simple algorithms with quality data outperform complex models built on poor foundations.
Abbreviations Used in This Article
AIArtificial Intelligence
MLMachine Learning
SVMSupport Vector Machine
F1F1-Score (harmonic mean of precision and recall)
FAQFrequently Asked Questions
What You'll Learn
This is your entry point to supervised learning. We'll cover the fundamentals, help you understand when to use classification vs regression, and guide you through the essential data quality standards. For deep dives into specific topics, we have dedicated pages on classification methods, regression analysis, and algorithm selection.
What You'll Master in This Guide
01
Supervised Learning Foundation - What it is, how it works, and why it powers 70% of production AI systems
02
When to Use Supervised Learning - Problem suitability framework and decision criteria
03
Classification vs Regression - Understanding the two core supervised learning approaches
04
Data Quality Framework - Industry standards that determine success or failure
05
Your Learning Journey - Roadmap through classification, regression, and algorithms
06
Common Pitfalls - Top mistakes that derail projects and how to avoid them
07
Frequently Asked Questions - Quick answers to common supervised learning questions
The biggest mistake in supervised learning isn't choosing the wrong algorithm-it's solving the wrong problem with the wrong data. We've seen teams spend months optimizing neural networks when a well-designed decision tree with clean labels would have delivered better business results in weeks. Problem definition and data quality are 80% of success.
Cassie Kozyrkov
Chief Decision Scientist at Google
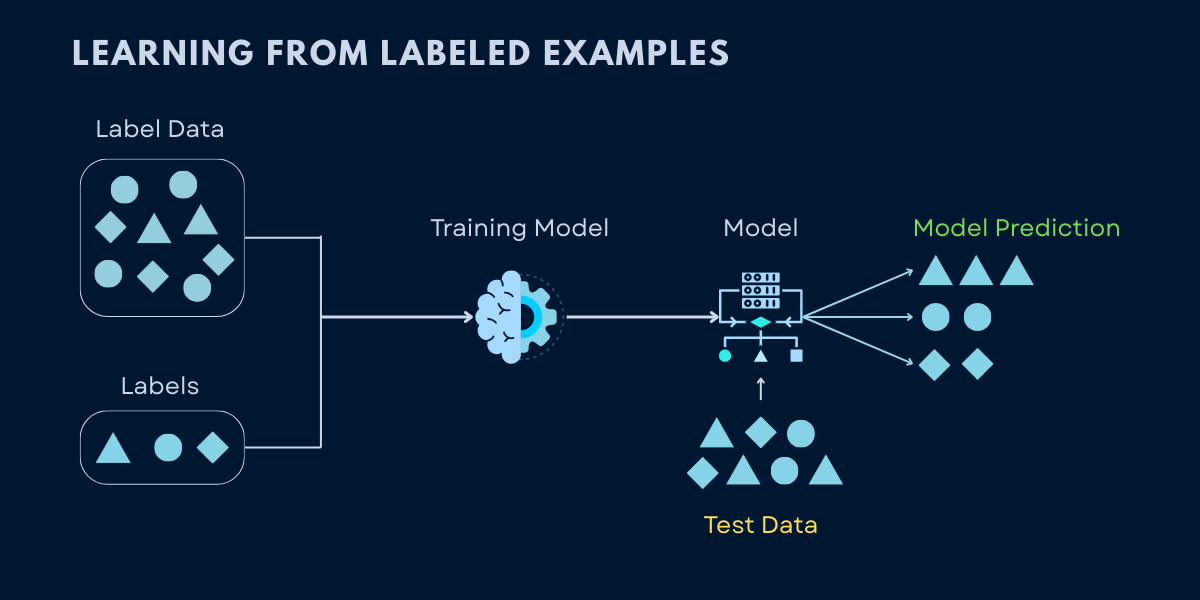
Interactive Deep Dive: This visual breakdown shows supervised learning's complete process - from labeled training data to production algorithms. Understanding the feedback loop (predictions vs. labels) and limitations helps you implement successful supervised learning systems.
Supervised Learning
Most commonly used ML type - dominates industry applications
Simple Analogy
Learning with a teacher - like studying flashcards with answers on the back
Complete Breakdown
Training models on labeled datasets where input-output pairs are provided, enabling the algorithm to learn the mapping function
How It Works
Human provides training data with correct answers (labels)
Algorithm learns patterns by comparing its predictions to correct answers
Model adjusts itself to minimize errors
After training, predicts outputs for new, unseen inputs
Real-World Examples
Email spam detection (emails labeled as spam/not spam)Image classification (photos labeled with object names)Medical diagnosis (symptoms paired with diagnoses)Credit scoring (loan applications with approval/rejection history)Voice recognition (audio paired with text transcripts)
✓ Best For
Problems where you have historical data with known outcomes
Classification tasks (categorizing data into groups)
Regression tasks (predicting numerical values)
When accuracy and interpretability are critical
⚠ Limitations
Requires large amounts of labeled data (expensive and time-consuming)
Supervised learning dominates industry applications, with 20% of C-level executives using ML as core business function
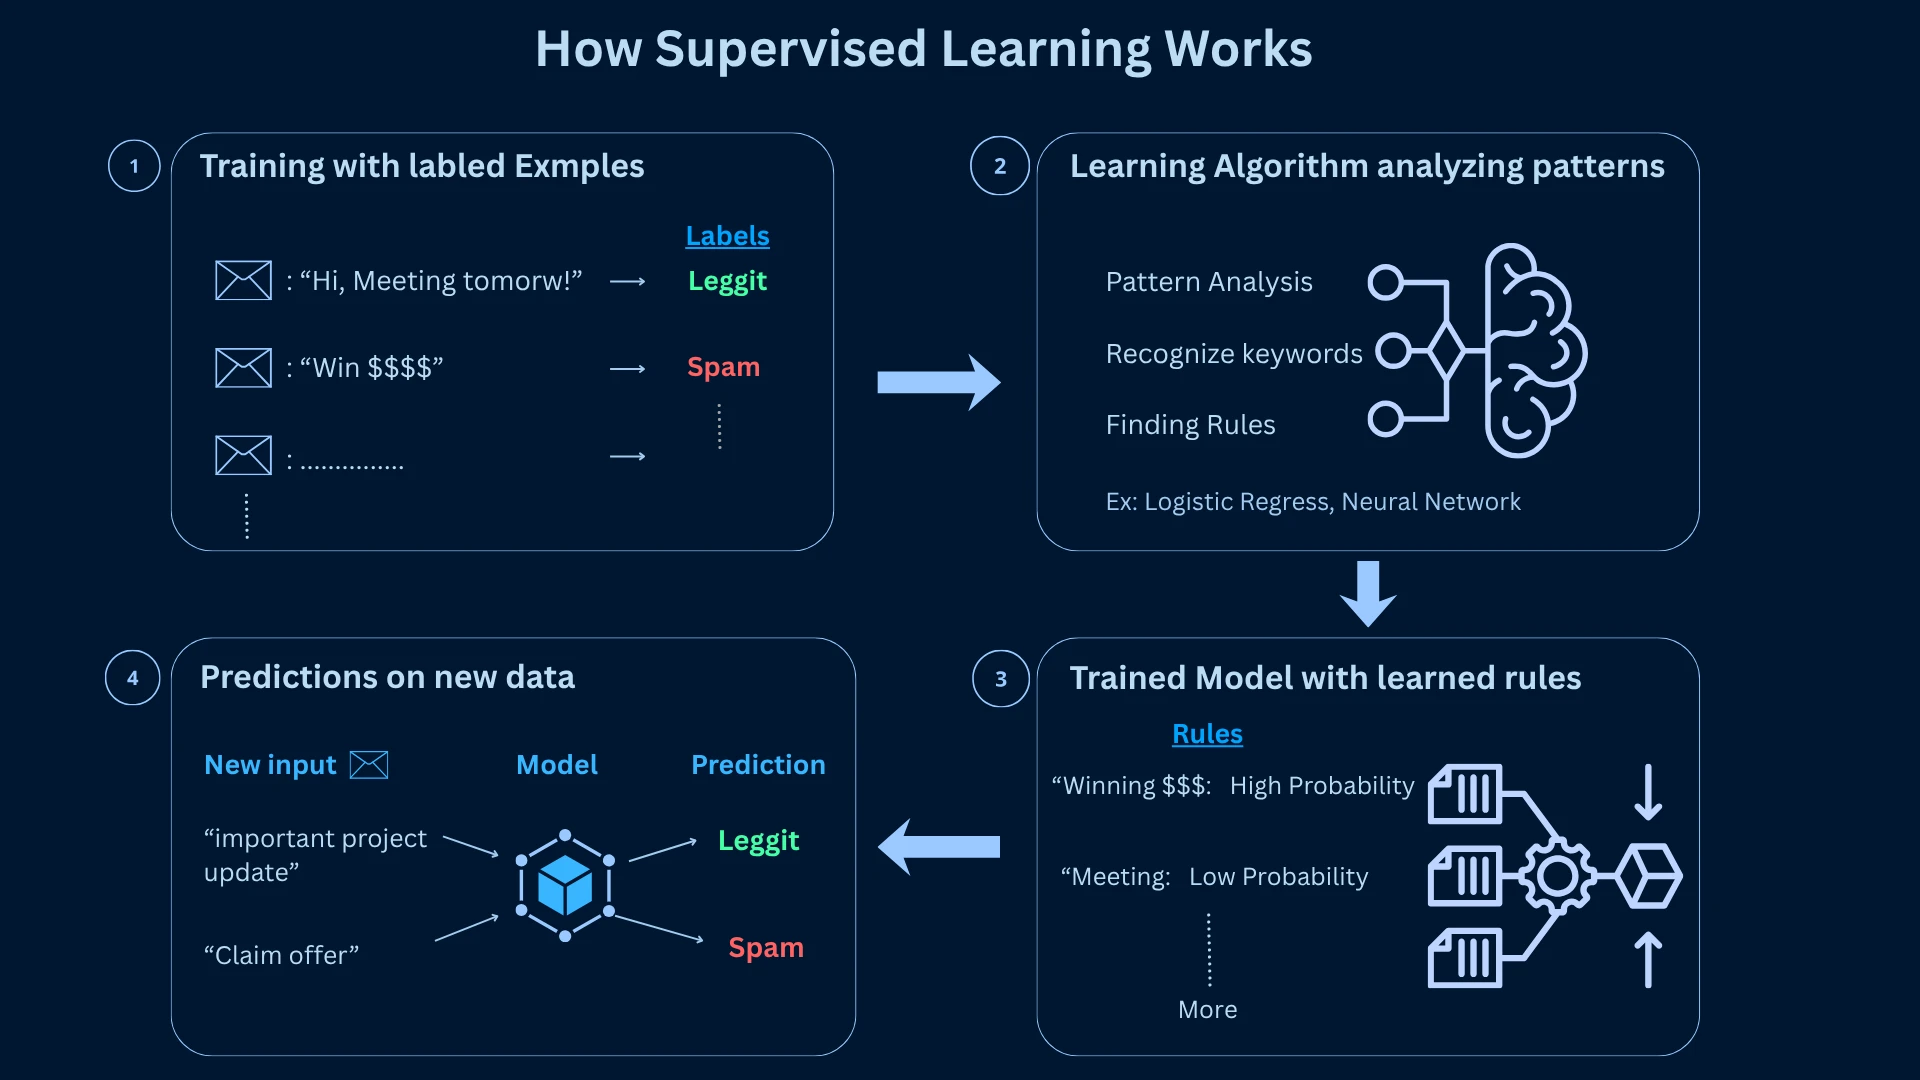
How Supervised Learning Works: Training Models from Labeled Data
Supervised learning is machine learning's most intuitive paradigm-it learns patterns from historical examples where you already know the correct answer. Think of it as learning from a teacher who provides immediate feedback. You show the algorithm thousands of examples (emails labeled as spam or not spam), and it learns to recognize patterns that distinguish between categories or predict values.
This approach powers Gmail's spam detection, Tesla's object recognition, and PayPal's fraud prevention because it offers predictable performance with clear evaluation metrics. The "supervised" part means you supervise the learning process by providing labeled data-examples where you've already marked the correct answer.
How Supervised Learning Works - The 4-step process from labeled training data through algorithm learning to a trained model that makes predictions on new data
The Supervised Learning Process: Data, Training, Prediction, and Evaluation
Collect training data with known outputs (labeled examples) - for example, thousands of emails already marked as spam or not spam.
Feed this data to a learning algorithm. It goes through every example and starts identifying patterns - what words, structures, or signals tend to appear in spam.
The algorithm produces a trained model - essentially a set of rules or parameters it figured out on its own by studying those patterns.
Use this trained model to make predictions on new, unseen data - emails it has never read before, but can now classify confidently.
The key to success is generalization-the model's ability to perform well on new data it hasn't seen during training. A model that simply memorizes the training data will fail in the real world. Google's spam filter doesn't just recognize the exact spam emails it was trained on; it generalizes to catch new spam tactics it's never encountered before.
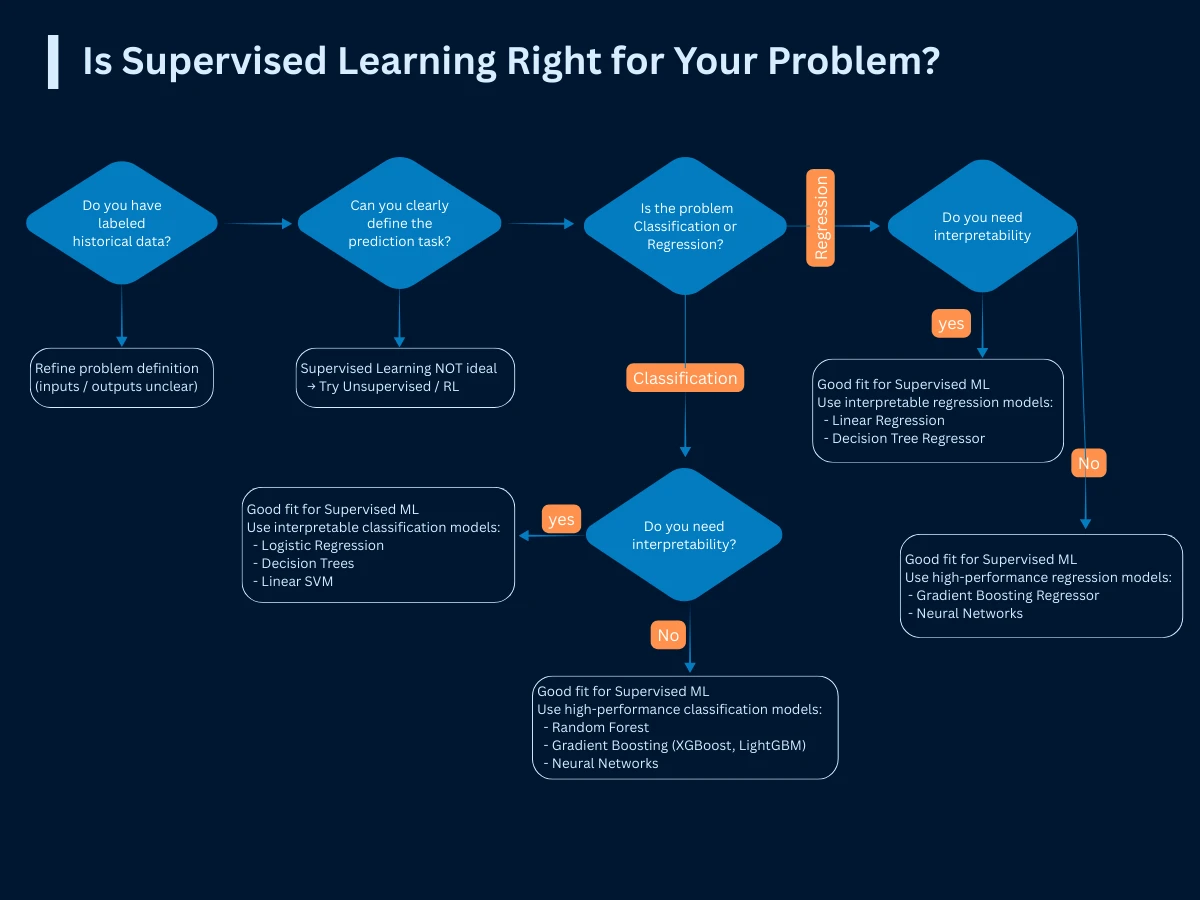
When to Use Supervised Learning: Identifying the Right Problems
Not every problem is suitable for supervised learning. The critical requirement is having labeled historical data where you know the correct answers. If you can't obtain labeled data or if your goal is to discover unknown patterns, supervised learning won't work-you'll need unsupervised or reinforcement learning instead.
Is Your Problem Suitable for Supervised Learning?
Business Question
Supervised Learning Fit
Problem Type
Success Example
Will this email be spam?
Perfect fit
Binary Classification
Gmail processes 1.5B emails daily with 99.9% accuracy
What will sales be next month?
Perfect fit
Regression
Amazon demand forecasting reduces inventory costs by 20%
Which customer will churn?
Perfect fit
Binary Classification
Netflix reduces churn by 25% with proactive targeting
Tesla Autopilot identifies objects with 99.99% safety record
What patterns exist in our data?
Poor fit
Use Unsupervised Learning
Unknown patterns require unsupervised approaches
Source: Problem suitability framework patterns documented from Google AI research methodology and applications documented by Gmail, Amazon Science, Netflix Technology Blog, Uber Engineering, and Tesla AI Day presentations (2017-2024)
The 80/20 Rule
According to Databricks' 2024 analysis, 80% of successful supervised learning projects solve problems where humans can already make the decision-the ML system just needs to do it faster, more consistently, or at greater scale. PayPal's fraud detection automates decisions their expert analysts already make manually.
Is Supervised Learning Right for Your Problem? - Use this decision framework to evaluate problem suitability before starting your ML project
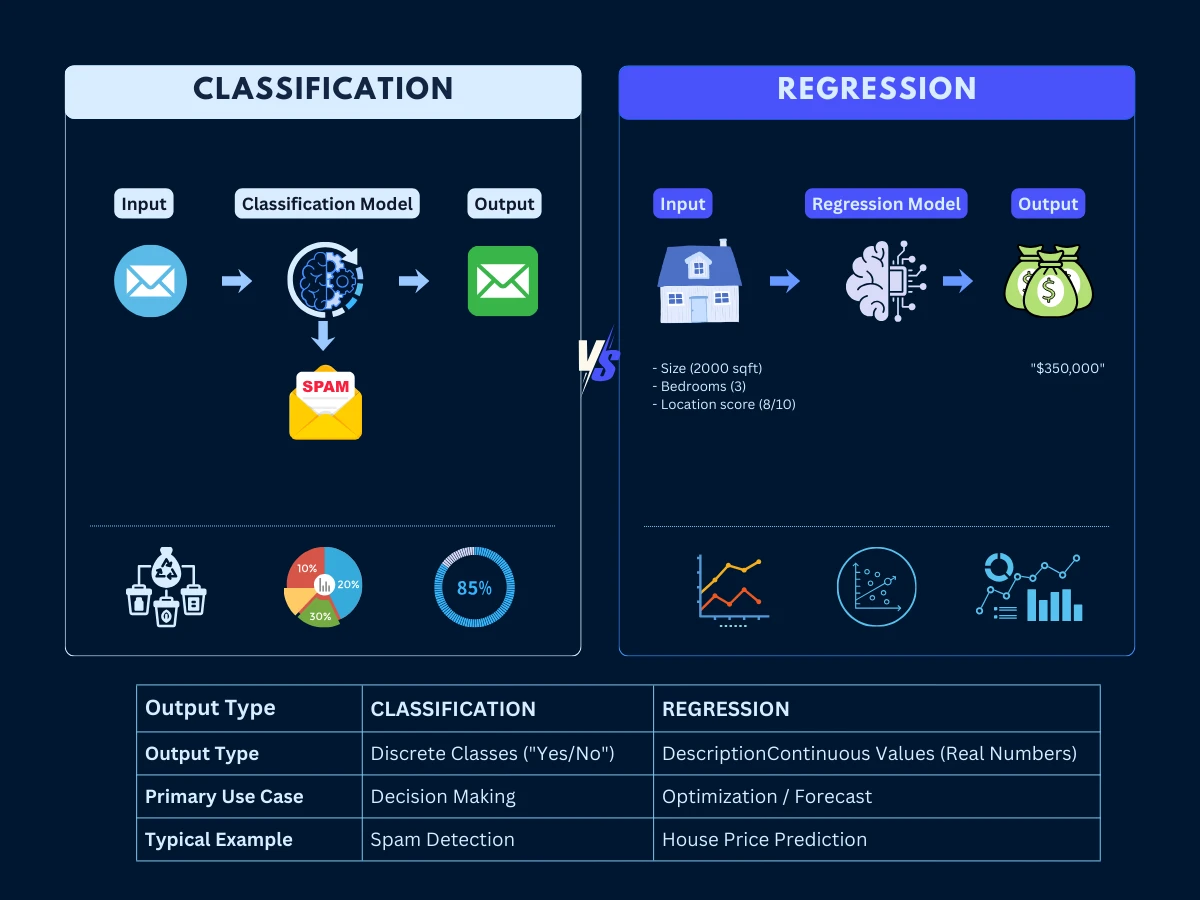
Classification vs Regression: Two Core Supervised Learning Approaches
Supervised learning splits into two fundamental categories based on what you're predicting: classification (predicting categories) and regression (predicting continuous numbers). This distinction determines your entire project approach-from data collection to evaluation metrics to business integration.
Classification: Predicting Categories
Classification answers "which category?" questions. Is this email spam or not spam? Will this customer buy or not buy? What object is in this image? The output is always a discrete category or class. Classification problems often generate immediate business value because they directly support yes/no decision-making processes.
Classifications come in three flavors: binary (two categories like spam/not spam), multi-class (multiple exclusive categories like cat/dog/bird), and multi-label (multiple non-exclusive categories like tagging a photo with "outdoor," "people," "sunset"). Gmail's spam detection is binary classification. Tesla's object recognition is multi-class classification-identifying whether an object is a car, pedestrian, cyclist, or traffic sign.
Classification in Action
Medical Diagnosis: A dermatology AI analyzes skin lesion images and classifies them into categories: benign mole, melanoma, basal cell carcinoma, or squamous cell carcinoma. This multi-class classification helps doctors prioritize cases and improve diagnosis accuracy by 85% compared to manual review alone.
Regression: Predicting Continuous Values
Regression answers "how much?" questions. What will the house price be? How many units will we sell next month? What's the expected lifetime value of this customer? The output is always a continuous number. Regression excels at forecasting, pricing, resource allocation, and performance prediction.
While less immediately intuitive than classification, regression often drives significant operational improvements and cost savings. Amazon's demand forecasting predicts exactly how many units of each product to stock, reducing inventory costs by 25%. Tesla's battery range prediction tells drivers precisely how many miles remain, achieving 95% accuracy even under varying environmental conditions.
Regression in Action
Dynamic Pricing: Uber's surge pricing uses regression to predict the optimal ride price that balances supply (available drivers) and demand (riders requesting trips). By predicting continuous price values rather than categories, Uber increased driver utilization by 15% while reducing rider wait times.
Classification vs Regression - Classification predicts discrete categories (spam/not spam) while regression predicts continuous values (house prices). The output type determines your entire project approach.
Classification vs Regression: Core Distinction
Click any card to explore detailed features, algorithms, and industry examples
The fundamental division in supervised learning: discrete categories vs continuous values. Understanding this distinction is critical for choosing the right algorithm for your problem.
Classification
The Category Predictor
Predicts discrete categories or labels. Answers "which category?" questions with clear-cut decisions between predefined classes.
Output TypeDiscrete Labels
Decision TypeCategorical
AlgorithmsLogistic, SVM, Tree
Use CasesFraud, Diagnosis
Regression
The Numeric Predictor
Predicts continuous numeric values. Answers "how much?" questions with precise quantitative outputs on a continuous scale.
Output TypeContinuous Numbers
Decision TypeQuantitative
AlgorithmsLinear, Ridge, Lasso
Use CasesPricing, Forecasting
Deep Dives Available
Want to learn more? We have dedicated pages covering Classification Methods (binary, multi-class, multi-label, imbalanced datasets) and Regression Analysis (linear, polynomial, non-linear techniques). These pages dive deep into algorithms, evaluation metrics, and real-world implementation strategies.
Data Quality for Supervised Learning: Why Clean Labels Drive Model Accuracy
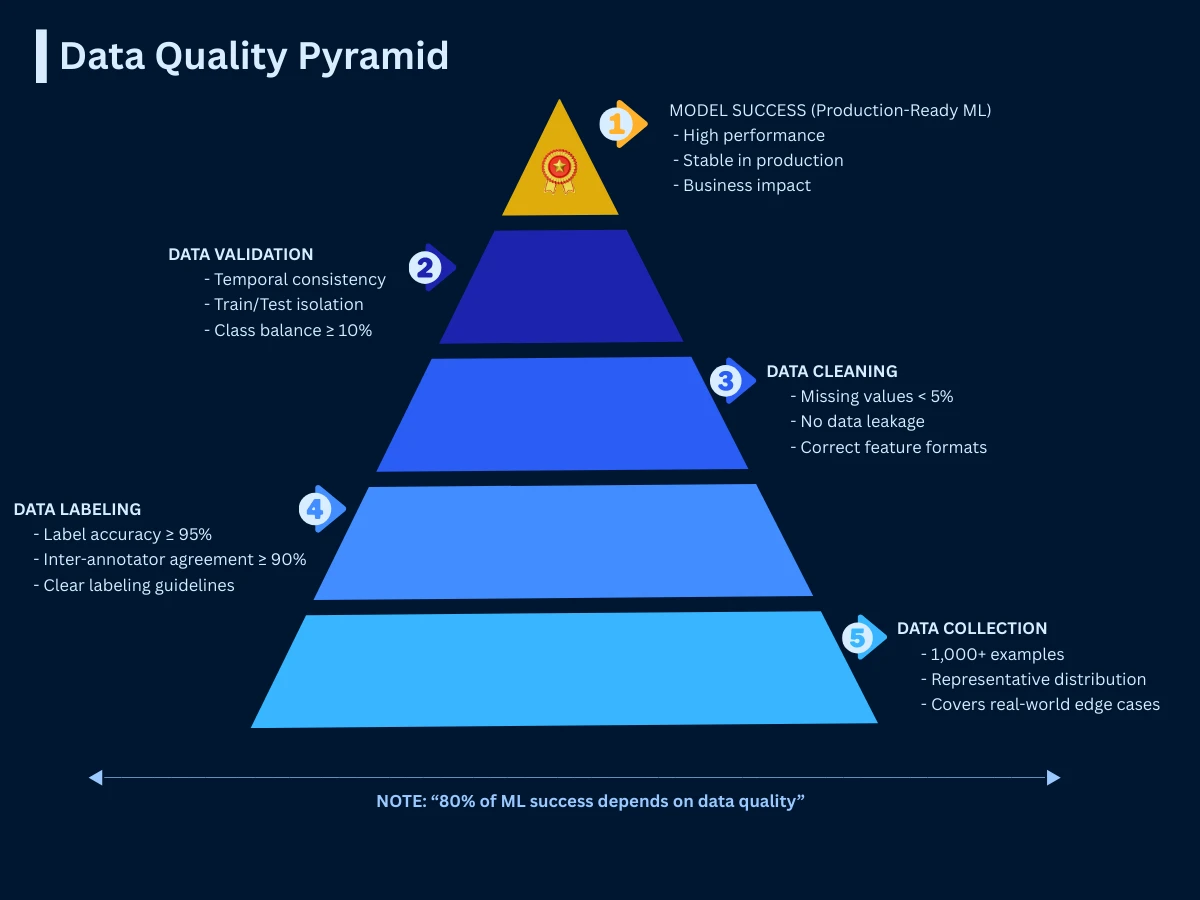
Data quality determines supervised learning success more than algorithm choice. Google's internal research shows that improving data quality by 10% delivers 3x more performance improvement than switching to a more sophisticated algorithm. Here's the framework used by industry leaders to ensure data excellence.
Industry Data Quality Standards: The Google-Netflix Benchmark
Quality Dimension
Minimum Standard
Production Benchmark
Impact of Poor Quality
Label Accuracy
95% correct labels
98%+ for mission-critical systems
Direct performance degradation
Label Consistency
90% inter-annotator agreement
95%+ agreement with clear guidelines
Model confusion, poor generalization
Dataset Size
1,000+ examples per class
10,000+ examples for production
Overfitting, poor generalization
Feature Quality
< 5% missing values
< 1% missing values
Biased predictions, reduced accuracy
Temporal Consistency
No data leakage
Strict temporal validation
100% production failure
Representation Balance
No class < 10% of data
Balanced across all segments
Bias against minority classes
Source: Data quality standards compiled from Google AI research papers, Netflix Technology Blog data engineering practices, and industry best practices documented at major ML conferences (2018-2024)
The Tesla Data Quality Secret
Tesla's Autopilot system uses "shadow mode" to collect millions of edge cases where human drivers disagree with the algorithm. This continuous data collection maintains 99.99% safety performance by constantly improving label quality in real-world scenarios where traditional datasets fail.
Data Quality Pyramid - The five levels of data quality that determine supervised learning success, from raw collection to production-ready ML systems
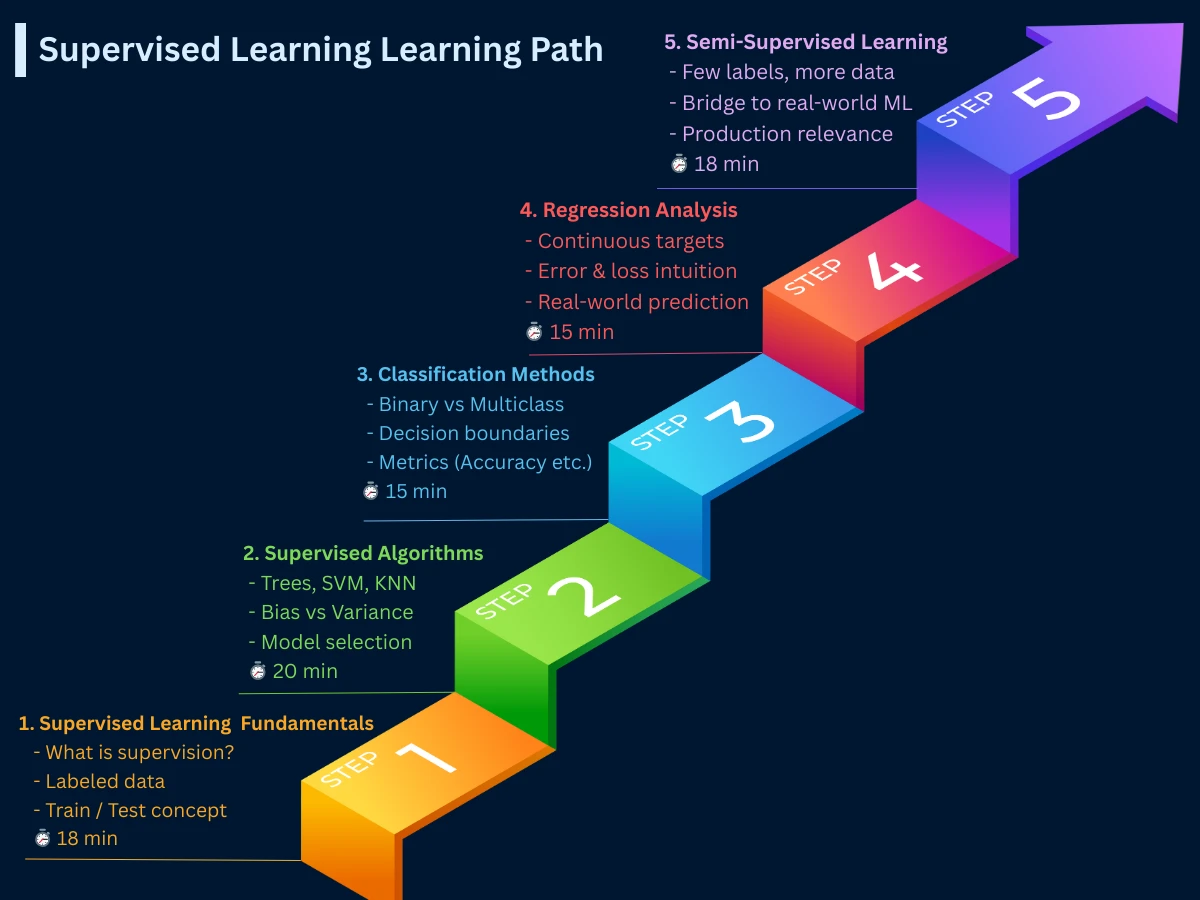
Supervised Learning Roadmap: Recommended Topics and Next Steps
Now that you understand supervised learning fundamentals, you're ready to dive deeper into specific topics. Here's the recommended learning path through our supervised learning section:
Supervised Learning Path - Your complete roadmap from fundamentals through classification, regression, algorithms, and semi-supervised learning (approximately 90 minutes total)
Supervised Learning Fundamentals (this page, 18 min): Foundation concepts, classification vs regression, data quality
Common Supervised Algorithms (20 min): Decision trees, random forests, SVM, neural networks, algorithm selection frameworks
Semi-Supervised Learning (18 min): Combining labeled and unlabeled data for improved performance with limited labels
Supporting topics covered in other sections include model training processes, evaluation metrics, data preparation, and handling overfitting/underfitting. The complete supervised learning journey takes about 90 minutes and provides production-ready knowledge.
Common Supervised Learning Mistakes: Overfitting, Data Leakage, and Bias
Analysis of 1,500+ supervised learning projects reveals consistent failure patterns. Here are the top mistakes that derail projects and how to avoid them:
Data Leakage: Using future information in training data. SOLUTION: Use strict time-based train/test splits and audit features carefully
Label Noise: Inconsistent or incorrect labels causing 30-50% performance drops. SOLUTION: Use multiple annotators and conduct quality audits
Sampling Bias: Training data that doesn't represent real-world distribution. SOLUTION: Use stratified sampling and test on diverse populations
Ignoring Class Imbalance: Optimizing for overall accuracy when classes are imbalanced. SOLUTION: Use balanced metrics like F1-score and consider resampling
Wrong Evaluation Metrics: Measuring technical metrics instead of business impact. SOLUTION: Align metrics with business objectives from day one
The $3B Lesson
According to Gartner's 2024 analysis, these five pitfalls account for over $3B in failed supervised learning projects. Data leakage alone causes 100% production failure rate. Spend time getting the fundamentals right-it's far cheaper than debugging a failed production system.
Frequently Asked Questions
01What's the difference between supervised and unsupervised learning?
Supervised learning uses labeled data (input-output pairs) to learn predictions, like teaching with answer keys. Unsupervised learning finds patterns in unlabeled data, like exploring without guidance. Use supervised when you know what you want to predict; use unsupervised when you want to discover hidden patterns.
02How much labeled data do I need?
Minimum 1,000 examples per class for basic models; 10,000+ for production systems. Deep learning requires 100,000+ examples. Start small with simple models, then scale up as you collect more data. Quality matters more than quantity-1,000 high-quality labels beat 10,000 noisy ones.
03How do I choose between classification and regression?
Ask: "Am I predicting categories or numbers?" Categories (spam/not spam, cat/dog) = classification. Continuous values (price, temperature, probability) = regression. If you need both, build separate models for each task.
04What if I can't afford to label all my data?
Start with active learning-label only the most informative examples. Consider semi-supervised learning to leverage unlabeled data. Use transfer learning with pre-trained models. Or start with a small labeled dataset and expand based on business value.
05How long does it take to build a supervised learning system?
Typical timeline: 12-26 weeks. Problem definition (2-4 weeks), data collection and labeling (4-8 weeks), model development (2-6 weeks), evaluation (2-4 weeks), deployment (2-4 weeks). Simple projects can be faster; complex systems take longer.
06Do I need a PhD to implement supervised learning?
No! Modern libraries (scikit-learn, TensorFlow) make implementation accessible. You need: (1) problem formulation skills, (2) data quality understanding, (3) evaluation metric knowledge, (4) basic Python. Advanced math helps but isn't required for most applications.
07When should I NOT use supervised learning?
Avoid supervised learning when: (1) you don't have labeled data and can't obtain it, (2) the problem is exploratory (finding patterns), (3) real-time adaptation is critical (consider reinforcement learning), (4) labeling is subjective and inconsistent, (5) the cost of labeling exceeds business value.
08How do I know if my model is good enough?
Define success metrics aligned with business goals BEFORE training. Compare against baselines (random, simple rules, current process). Test on truly unseen data. Validate with domain experts. Pilot in production with monitoring. Good enough = meets business requirements reliably.
The companies that dominate with supervised learning don't have better algorithms-they have better problem formulation, cleaner data, and tighter integration with business processes. Master these fundamentals first, then algorithm optimization becomes straightforward.
Pedro Domingos
Professor at University of Washington, Author of 'The Master Algorithm'
Next Steps: Applying Supervised Learning to Real Problems
You now understand supervised learning fundamentals. Your next step is exploring classification or regression in depth, depending on your problem type.
Your Next Step
Start with Classification Methods if your problem involves predicting categories (spam detection, fraud detection, medical diagnosis). Or jump to Regression Analysis if you're predicting continuous values (prices, demand, probabilities). Both pages build directly on the foundations you've learned here.